140 Texas Water Damage Statistics (November 2026)
Freeze claims, flood risk, household leaks, mold and insurance costs in Texas and Dallas-Fort Worth, each number linked to the agency that produced it.
Call now, a real person answers 24/7(469) 991-2658- Free inspection & estimate
- Help with your insurance claim
- Local Dallas crews, day or night
Talk to a Dallas Crew Now
A real person picks up 24/7. No forms, no waiting for a callback.
(469) 991-2658- Tell us what happenedAddress, where the water came from, which rooms are wet.
- Get an arrival windowA local crew heads to Dallas with pumps, air movers, and meters.
- Free inspection & estimateMoisture mapping and a clear price before any work starts.
Water still coming in? The person who answers walks you through shutting it off.
What to tell us
when you call
- Your addressStreet and ZIP so the closest crew rolls
- Where the water came fromPipe, appliance, roof, sewer, flood
- Is it still coming in?We talk you through shutting it off
- Which rooms are wetFloors, walls, ceilings, how long
One week of cold in February 2021 produced more than half a million Texas insurance claims, and broken pipes did a large share of the damage. The state has since seen its second-wettest day on record in Dallas-Fort Worth, a near doubling of home insurance premiums, and a statewide flood plan that puts millions of Texans inside mapped flood zones.
This page collects the numbers behind water damage in Texas, with a close look at Dallas and North Texas. Every figure links to the agency or researcher that produced it: the Texas Department of Insurance, the National Weather Service, FEMA, the EPA, the City of Dallas and others.
We update the page every month as new data comes out.
Updated November 2026. 140 statistics, each linked to its original source.
Texas water damage at a glance
- Texans filed 511,473 insurance claims after the February 2021 freeze, and insurers expect to pay about $11.5 billion (Texas Department of Insurance, Nov 2022).
- Dallas County alone accounted for 48,479 of those claims and $1.23 billion in paid losses (Texas Department of Insurance, Nov 2022).
- Texas homeowners insurers paid $4.75 billion for water and freeze damage in 2021, up from $838 million in 2020 (Texas Department of Insurance, Oct 2026).
- The average Texas homeowners premium reached $3,489 in 2025, up from $1,791 in 2016 (Texas Department of Insurance, Oct 2026).
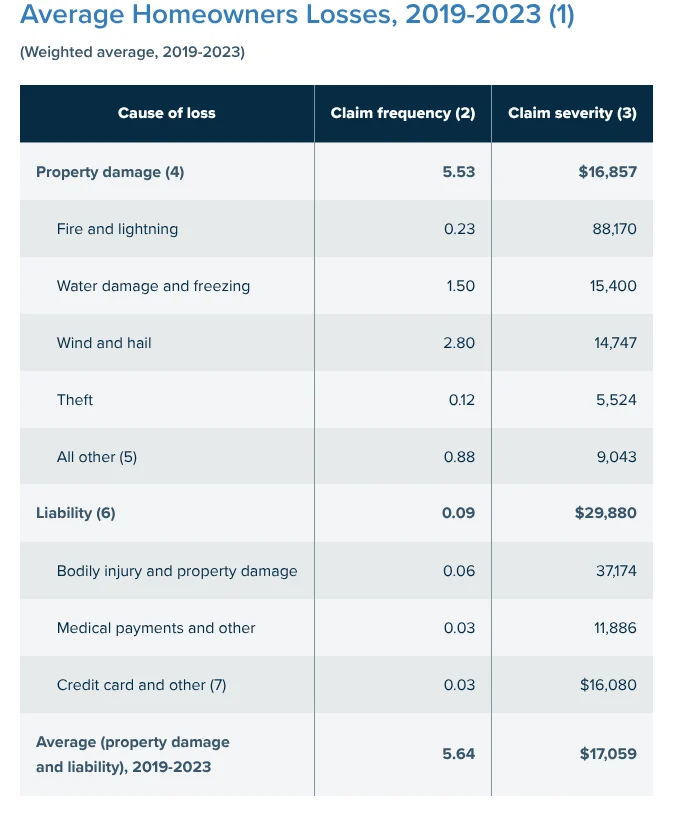
- Nationally, the average water damage and freezing claim costs $15,400, and insurers see 1.50 such claims per 100 insured homes each year (Insurance Information Institute, Nov 2026).
- The cost of an average non-weather water claim, such as a leaking pipe or appliance, rose 63.16% from 2019 to 2025 (LexisNexis Risk Solutions, Jul 2026).
- 31% of Texans reported water damage to their home after the 2021 winter storm (University of Houston Hobby School, Mar 2021).
- About one in six Texans lives or works in a known flood hazard area (Texas Water Development Board, Aug 2024).
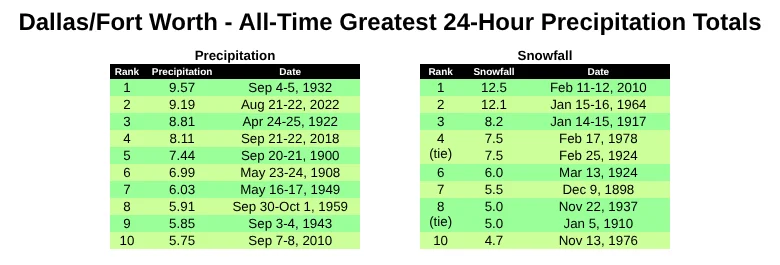
- DFW Airport recorded 9.19 inches of rain in 24 hours on August 21 and 22, 2022, the second-highest total in records that go back to 1898 (National Weather Service, Sep 2022).
- One inch of floodwater can cause roughly $25,000 in damage to an average size home (FEMA, Oct 2022).
- Water-damaged areas and items need to be dried within 24 to 48 hours to prevent mold growth (EPA, Feb 2026).
- Dallas cut water main repairs from 37 per 100 miles of pipe in fiscal 2011-12 to 20 in fiscal 2024-25 (City of Dallas, Aug 2026).
- 86% of high-risk U.S. properties had no National Flood Insurance Program coverage as of April 2026 (U.S. Government Accountability Office, Oct 2026).
How common and how costly are water damage claims?
Water is the claim most homeowners never plan for. Hail gets the headlines in Texas, but water and freezing damage sits second in the national claim counts and costs more per claim than wind or hail.
How often do homes file water damage claims?
About one insured home in 60 files a water damage or freezing claim in a given year. The newer 2019 to 2023 rate of 1.50 claims per 100 homes works out to closer to one in 67, by our math.
- Triple-I's own summary, built on 2018 to 2020 data, says about one in 60 insured homes has a water damage or freezing claim each year (Insurance Information Institute, Nov 2026).
- Wind and hail lead all causes at 2.80 claims per 100 insured homes (Insurance Information Institute, Nov 2026).
- Across every cause, insurers recorded 5.33 claims per 100 insured homes in 2023 (Insurance Information Institute, Nov 2026).
- Water damage and freezing made up 22.6% of homeowners losses in 2023 and 28.7% in 2019 (Insurance Information Institute, Nov 2026).
- These national tables leave out Texas, Alaska and Puerto Rico, so Texas needs its own data, which the sections below supply (Insurance Information Institute, Nov 2026).
How does a water claim compare with other claims?
A water claim costs more than a wind, hail or theft claim and far less than a fire claim.
- The average wind and hail claim costs $14,747 (Insurance Information Institute, Nov 2026).
- The average fire and lightning claim costs $88,170 (Insurance Information Institute, Nov 2026).
- The average theft claim costs $5,524 (Insurance Information Institute, Nov 2026).
- The average homeowners claim of any kind reached $20,062 in 2023, up from $13,884 in 2019 (Insurance Information Institute, Nov 2026).
Where does Texas rank on home insurance cost?
Texas ranks near the top. NAIC data published by Triple-I put the average Texas HO-3 premium at $2,397 in 2022, third highest among the states and D.C., against a U.S. average of $1,569 (Insurance Information Institute, Nov 2026).
Is water damage getting more expensive?
Yes. Insurers see fewer water claims than they did a few years ago, and each one costs far more to fix. Texas homeowners feel that through their premiums.
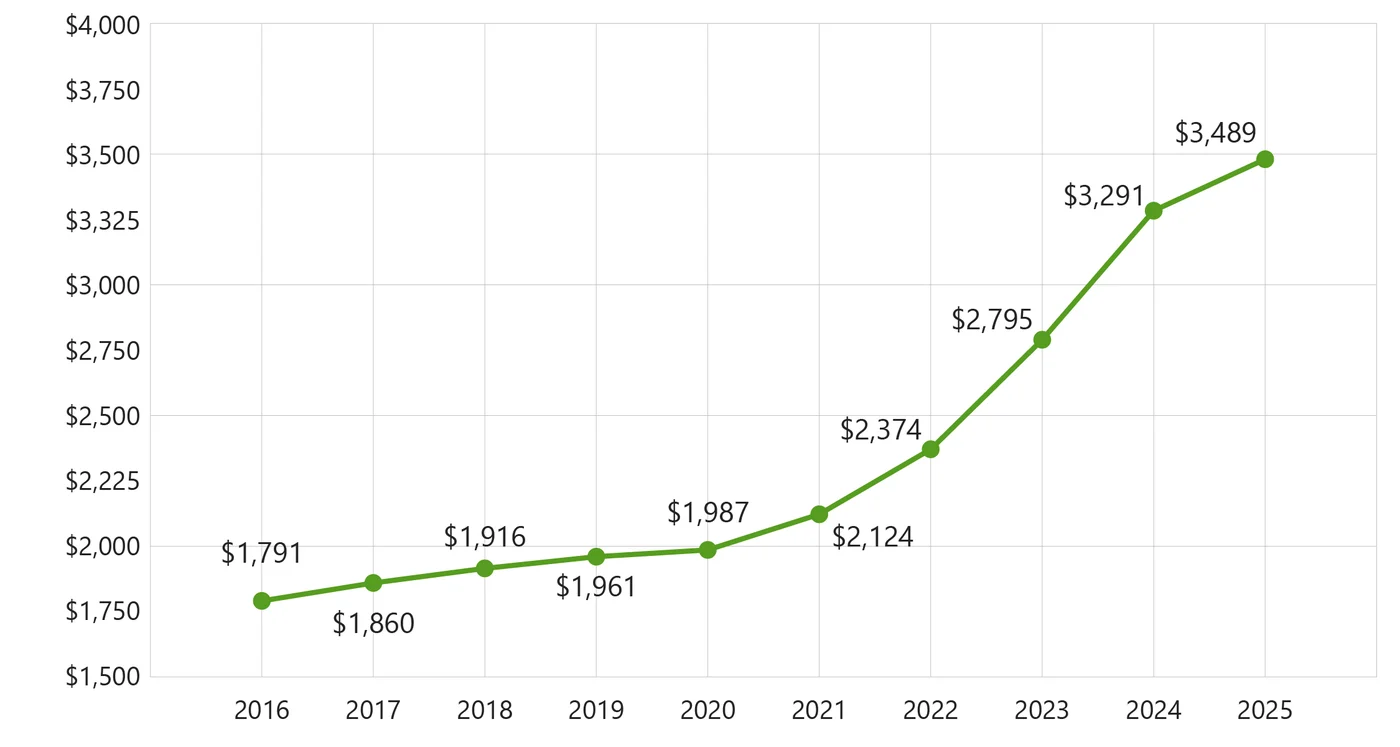
Are water claims rising in cost?
Claim counts are falling while the cost per claim climbs. LexisNexis attributes the rise in water claim cost to inflation and higher material and labor prices.
- Non-weather water claim frequency fell 7.8% from 2024 to 2025 (LexisNexis Risk Solutions, Jul 2026).
- The cost of the average non-weather water claim still rose 2.5% over the same year (LexisNexis Risk Solutions, Jul 2026).
- Total non-weather water loss cost fell 6.4% from 2024 to 2025 (LexisNexis Risk Solutions, Jul 2026).
- Across all perils, average claim cost rose 25.9% in 2025 to an all-time high (LexisNexis Risk Solutions, Jul 2026).
- All-peril claim cost in 2025 stood 93.2% above its 2019 level (LexisNexis Risk Solutions, Jul 2026).
How fast have Texas premiums climbed?
Texas rates jumped by double digits three years in a row before cooling in 2025.
- Texas insurers raised home rates an average of 21.1% in 2023 (Texas Department of Insurance, Oct 2026).
- Rates rose another 18.7% in 2024 (Texas Department of Insurance, Oct 2026).
- The average increase slowed to 4.3% in 2025 (Texas Department of Insurance, Oct 2026).
- Insurers filed rate requests averaging a 4.0% decrease for the 90 days from August through October 2026 (Texas Department of Insurance, Oct 2026).
- The average Texas home is now insured for $432,800, up from $252,000 in 2016 (Texas Department of Insurance, Oct 2026).
- Texas had 8,233,096 active homeowners policies in 2025 (Texas Department of Insurance, Oct 2026).
- Texans paid $19.75 billion in homeowners premiums in 2025 (Texas Department of Insurance, Oct 2026).
How much do Texas insurers pay out?
Texas homeowners insurers paid more than $10 billion in losses in two of the last four reported years.
- Insured homeowners losses in Texas totaled $10.2 billion in 2024 (Texas Department of Insurance, Oct 2026).
- Losses hit $10.3 billion in 2021, the year of the freeze (Texas Department of Insurance, Oct 2026).
- Insurers paid out $1.04 in losses for every premium dollar in 2021, a 104.0% loss ratio (Texas Department of Insurance, Oct 2026).
- The loss ratio fell to 45.6% in 2025 (Texas Department of Insurance, Oct 2026).
How fast must a Texas insurer answer a claim?
Texas sets deadlines in business days, and a homeowner who knows them can tell a normal wait from a stalled claim.
- An insurer has 15 business days to acknowledge a claim (Texas Department of Insurance, Apr 2025).
- It has 15 business days after it receives what it asked for to say whether it will pay (Texas Department of Insurance, Apr 2025).
- Once it agrees to pay, it must pay within five business days (Texas Department of Insurance, Apr 2025).
- The insurer can extend its decision deadline by 45 days if it explains why (Texas Department of Insurance, Apr 2025).
- TDI can add 15 more days to these deadlines after a weather catastrophe (Texas Department of Insurance, Apr 2025).
What causes water damage inside a home?
Most water damage starts small. A worn supply line or a slow leak runs for weeks before anyone sees a stain, and the EPA's numbers show how common those leaks are.
How much water do household leaks waste?
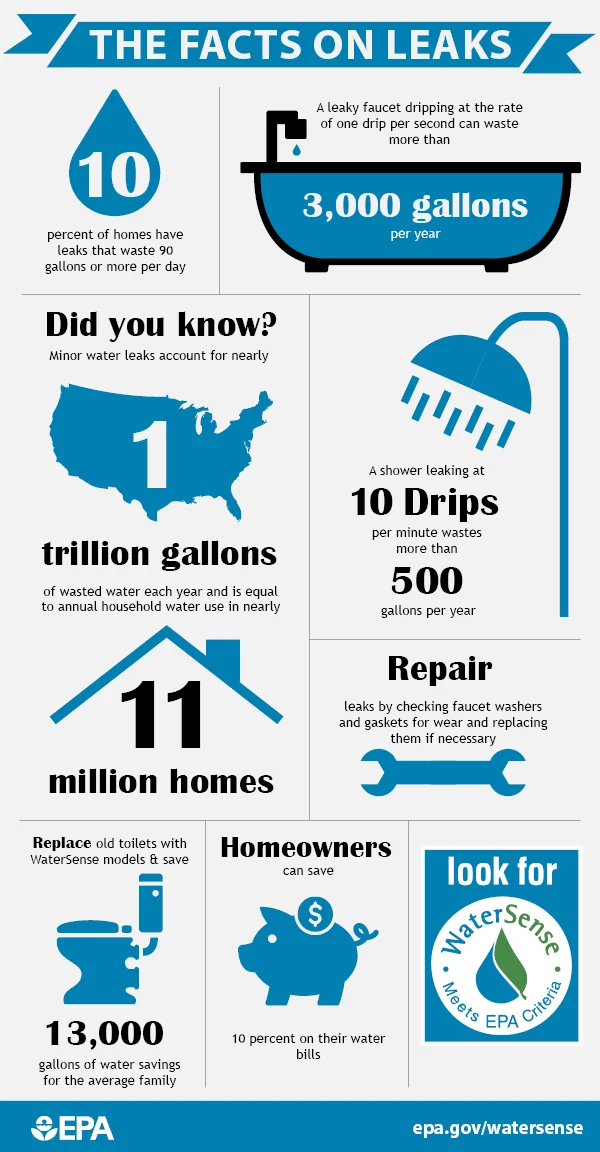
The average home loses thousands of gallons a year to leaks, and about one home in eleven loses far more.
- The average household's leaks waste more than 9,300 gallons of water a year (EPA WaterSense, Mar 2026).
- Household leaks waste nearly 1 trillion gallons a year nationwide (EPA WaterSense, Mar 2026).
- EPA's statistics page gives a lower national estimate of nearly 900 billion gallons (EPA WaterSense, Mar 2026).
- 9% of homes have leaks that waste 50 gallons or more a day (EPA WaterSense, Mar 2026).
- The average family can waste 180 gallons a week to leaks (EPA WaterSense, Mar 2026).
Which small leaks add up fastest?
A single dripping fixture wastes hundreds to thousands of gallons a year.
- A faucet that drips once per second wastes more than 3,000 gallons a year (EPA WaterSense, Mar 2026).
- A showerhead that drips 10 times a minute wastes more than 500 gallons a year (EPA WaterSense, Mar 2026).
- An irrigation leak 1/32 of an inch wide can waste about 6,300 gallons a month (EPA WaterSense, Mar 2026).
- A family of four that uses more than 12,000 gallons in a winter month likely has a serious leak (EPA WaterSense, Mar 2026).
What do leaks cost on the water bill?
Leaks show up on the bill before they show up on the ceiling.
- Fixing easily corrected leaks saves homeowners about 10% on their water bills (EPA WaterSense, Mar 2026).
- The average family spends more than $1,000 a year on water (EPA WaterSense, Mar 2026).
What do Texas freezes cost homeowners?
A hard freeze is the most expensive water damage event Texas has on record. The February 2021 storm showed what a week below freezing does to household plumbing.
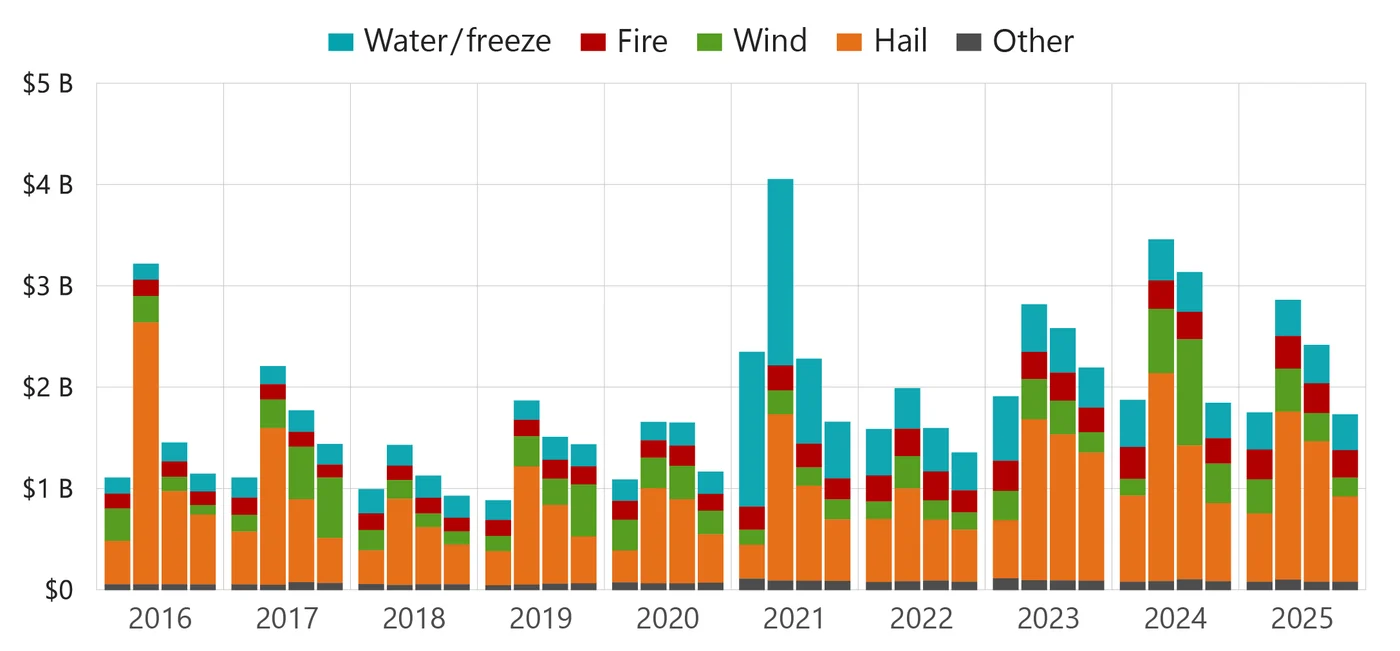
How much damage did the 2021 freeze do to homes?
Homes took most of the claims. TDI's last report on the storm, with data through June 30, 2022, shows residential property made up about 85% of all claims (Texas Department of Insurance, Nov 2022).
- Insurers had paid $8.8 billion to policyholders by June 30, 2022 (Texas Department of Insurance, Nov 2022).
- The average residential loss was $17,804, compared with $13,123 for Hurricane Harvey at the same point after that storm (Texas Department of Insurance, Nov 2022).
- Harvey produced more claims overall, at 764,898 (Texas Department of Insurance, Nov 2022).
- 59.4% of freeze claims closed with a payment (Texas Department of Insurance, Nov 2022).
- 38.0% closed without a payment (Texas Department of Insurance, Nov 2022).
- Residential claims took an average of 61.4 days to close (Texas Department of Insurance, Nov 2022).
- Water and freeze losses stayed high after 2021: Texas homeowners insurers paid $1.93 billion in 2023 and $1.61 billion in 2024 (Texas Department of Insurance, Oct 2026).
How hard did the freeze hit Dallas-Fort Worth?
Dallas, Tarrant, Collin and Denton counties together produced about a quarter of the state's claims and about a third of its paid losses, by our math on TDI's county table.
- Tarrant County: 36,405 claims and $747.1 million in paid losses (Texas Department of Insurance, Nov 2022).
- Collin County: 21,723 claims and $595.8 million (Texas Department of Insurance, Nov 2022).
- Denton County: 16,188 claims and $420.5 million (Texas Department of Insurance, Nov 2022).
- Harris County led the state with 112,163 claims (Texas Department of Insurance, Nov 2022).
How cold did Dallas get?
DFW went below zero and spent most of ten days at or below freezing.
- DFW Airport fell to -2°F on February 16, 2021 (National Weather Service, Feb 2021).
- The airport stayed at or below freezing for 139 straight hours, from February 13 to February 19 (National Weather Service, Feb 2021).
- That followed an earlier 93-hour stretch at or below freezing from February 9 to February 13 (National Weather Service, Feb 2021).
- The DFW record is 295 straight hours at or below freezing, set in December 1983 (National Weather Service, Nov 2026).
- DFW averages 29 freezes a season (National Weather Service, May 2021).
- The average first freeze arrives November 22 and the average last freeze falls on March 12 (National Weather Service, Nov 2026).
What did Texans go through?
The storm cut water and power to much of the state at once.
- 49% of Texans lost running water, for an average of 52 hours (University of Houston Hobby School, Mar 2021).
- 69% lost power, for an average of 42 hours (University of Houston Hobby School, Mar 2021).
- 44% had insulated their pipes before the storm (University of Houston Hobby School, Mar 2021).
- 29% had trouble finding a plumber or other service professional (University of Houston Hobby School, Mar 2021).
- Only 18% of those with water damage thought insurance would likely cover all of it (University of Houston Hobby School, Mar 2021).
- 17% of those with water damage had no insurance (University of Houston Hobby School, Mar 2021).
- Nearly 4 million Texas electric customers, more than 11 million people, lost power (Federal Reserve Bank of Dallas, Apr 2021).
- Early estimates put the economic loss to Texas at $80 billion to $130 billion (Federal Reserve Bank of Dallas, Apr 2021).
- The state confirmed 246 storm-related deaths across 77 counties (Texas Department of State Health Services, Dec 2021).
- 22 of those deaths were in Dallas County (Texas Department of State Health Services, Dec 2021).
If a pipe has burst in your Dallas-area home, Dallas Water Damage Pros connects you with a local restoration crew at any hour: (469) 991-2658.
How much flood risk does Dallas-Fort Worth carry?
More than most residents think. North Texas swings between drought and downpour, and the heaviest rain on record keeps arriving in the last ten years.
How much rain can fall on Dallas in a day?
More than nine inches. The top of the record book is a mix of century-old storms and very recent ones.
- The DFW 24-hour record is 9.57 inches, set September 4 and 5, 1932 (National Weather Service, Sep 2022).
- September 21 and 22, 2018 ranks fourth at 8.11 inches (National Weather Service, Sep 2022).
- During the August 2022 storm, 2.73 inches fell in 45 minutes, a DFW record for that span (National Weather Service, Sep 2022).
- August 2022 finished with 10.68 inches of rain (National Weather Service, Nov 2026).
- DFW's normal annual rainfall is 37.01 inches (National Weather Service, May 2021).
- The wettest year on record is 2015, with 62.61 inches (National Weather Service, Nov 2026).
- 2018 ranks second, with 55.97 inches (National Weather Service, Nov 2026).
- May 2015 alone brought 16.96 inches (National Weather Service, Nov 2026).
- The driest year on record is 1921, with 17.91 inches (National Weather Service, Nov 2026).
How many Texans live in flood zones?
Millions. The state's first flood plan, adopted in 2024, mapped flood hazard for all of Texas for the first time.
- More than 5.8 million Texans live or work in flood hazard areas, counting flood-prone areas of undetermined risk (Texas Water Development Board, Aug 2024).
- About 2.4 million of them are in the 100-year floodplain (Texas Water Development Board, Aug 2024).
- About 878,100 buildings stand in the 100-year floodplain (Texas Water Development Board, Aug 2024).
- The plan counts 1,295,700 residential buildings exposed to existing flood risk (Texas Water Development Board, Aug 2024).
- About one-fourth of Texas land, 66,831 square miles, falls in the 100-year or 500-year floodplain (Texas Water Development Board, Aug 2024).
- All 254 Texas counties have had a federally declared flood disaster (Texas Water Development Board, Aug 2024).
- Hurricane Harvey flooded about 80,000 homes in 2017 (Texas Water Development Board, Aug 2024).
- Under projected future conditions, about 2.6 million more people would fall inside the 100-year floodplain (Texas Water Development Board, Aug 2024).
How much of Dallas sits in a floodplain?
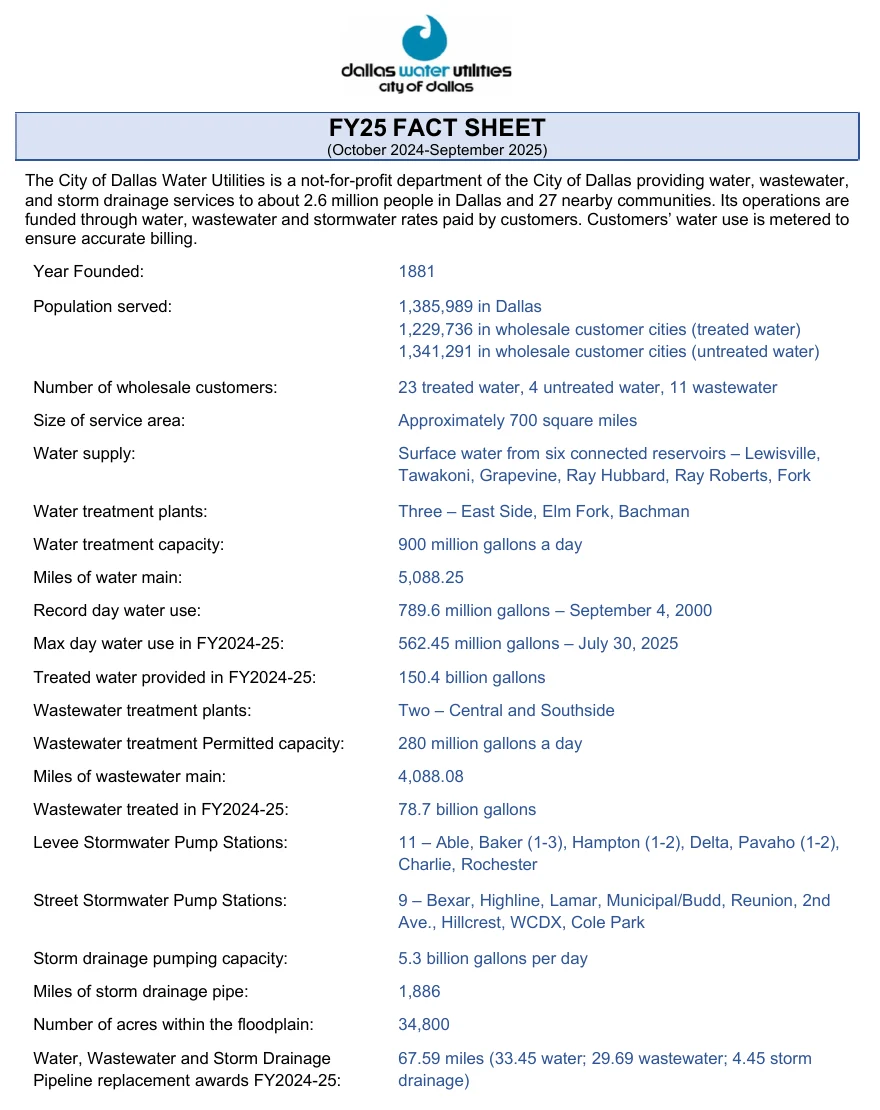
The City of Dallas counts 34,800 acres inside the floodplain (Dallas Water Utilities, Sep 2025).
- The city maintains 1,886 miles of storm drainage pipe (Dallas Water Utilities, Sep 2025).
- Its storm drainage pumps can move 5.3 billion gallons a day (Dallas Water Utilities, Sep 2025).
- Dallas runs 11 levee stormwater pump stations and 9 street stormwater pump stations (Dallas Water Utilities, Sep 2025).
Who has flood insurance?
Very few people outside mapped high-risk zones, and that is where a large share of claims come from. Standard homeowners policies do not cover flood.
- People outside high-risk areas file around 40% of NFIP claims (FEMA, Oct 2022).
- An estimated 43% of properties inside special flood hazard areas have flood insurance, against 2% outside them (U.S. Government Accountability Office, Oct 2026).
- NFIP policies fell from 5.5 million in 2010 to 4.5 million in 2026 (U.S. Government Accountability Office, Oct 2026).
- Private insurers wrote 14% of all flood policies in 2025 (U.S. Government Accountability Office, Oct 2026).
- A home in a 1% annual risk zone has a 26% chance of flooding over a 30-year mortgage (FEMA, Oct 2022).
- Most NFIP policies take effect 30 days after purchase (FEMA, Oct 2022).
- From 2016 to 2022, the average FEMA disaster assistance grant was $3,000 (FEMA, May 2023).
- The same FEMA fact sheet puts the average NFIP claim payment at more than $66,000 (FEMA, May 2023).
- Flood losses in the U.S. run about $2.4 billion a year (FEMA, Oct 2022).
How much moving water is dangerous?
Less than a foot.
- Six inches of fast-moving floodwater can knock over an adult (National Weather Service, Nov 2026).
- Twelve inches of rushing water can carry away most cars (National Weather Service, Nov 2026).
- Two feet can carry away SUVs and trucks (National Weather Service, Nov 2026).
- CDC figures cited by the Weather Service show more than half of flood drownings happen when a vehicle drives into floodwater (National Weather Service, Nov 2026).
How old are Dallas pipes, and how fast does mold follow a leak?
Dallas has cut its water main repair rate nearly in half since 2012, which is good news. The mold clock inside a wet house has not changed: you get a day or two.
How big and how old is the Dallas water system?
It is one of the largest in Texas, and a good share of it is decades old.
- Dallas Water Utilities maintains 5,088.25 miles of water main (Dallas Water Utilities, Sep 2025).
- It maintains another 4,088.08 miles of wastewater main (Dallas Water Utilities, Sep 2025).
- The system serves about 2.6 million people in Dallas and 27 nearby communities (Dallas Water Utilities, Sep 2025).
- A 2015 city audit put the average age of a Dallas water pipeline at 42 years (Dallas City Auditor, Dec 2015).
- The same audit found cast iron had dropped from 51% to 41% of water pipeline miles (Dallas City Auditor, Dec 2015).
- Dallas replaces about 40 miles of pipeline a year and has replaced more than 400 miles in the past 10 years (City of Dallas, Jun 2026).
- In fiscal 2024-25 the city awarded 67.59 miles of water, wastewater and storm pipeline replacement (Dallas Water Utilities, Sep 2025).
- Dallas spends $150 million to $175 million a year replacing and upgrading water and wastewater mains (City of Dallas, Aug 2026).
How much water does the Dallas system lose?
Billions of gallons a year leak from city mains before reaching a meter.
- The 2026 audit found real water losses of 10.36 billion gallons, up from 10.15 billion gallons in 2024 (City of Dallas, Jun 2026).
- Dallas delivers nearly 400 million gallons of water on an average day (City of Dallas, Aug 2026).
- Daily use passes 600 million gallons in extreme heat, which adds strain on older mains (City of Dallas, Aug 2026).
- The highest single day in fiscal 2024-25 was 562.45 million gallons, on July 30, 2025 (Dallas Water Utilities, Sep 2025).
How fast does mold follow water damage?
Fast enough that drying is the first job after the water stops.
- EPA says homeowners can handle a moldy area smaller than about 10 square feet themselves (EPA, Feb 2026).
- EPA recommends indoor humidity below 60%, ideally between 30% and 50% (EPA, Feb 2026).
- CDC sets a simpler ceiling: no higher than 50% humidity, all day long (CDC, Sep 2024).
- For cleanup, CDC says to use no more than 1 cup of household bleach per gallon of water (CDC, Sep 2024).
- In Texas, visible mold under 25 contiguous square feet may be cleaned by people who are not licensed (Texas Department of Licensing and Regulation, Jan 2025).
- At 25 contiguous square feet or more in a residential property with 10 or more units, Texas requires a licensed mold remediator (Texas Department of Licensing and Regulation, Jan 2025).
What does damp housing do to health?
Damp, moldy homes are common, and researchers link them to asthma and respiratory infections.
- An average of 47% of U.S. homes showed dampness or mold across seven studies (Lawrence Berkeley National Laboratory, Nov 2026).
- Researchers attribute 21% of current asthma cases to dampness or mold in homes (Lawrence Berkeley National Laboratory, Nov 2026).
- That works out to about 4.6 million asthma cases (Lawrence Berkeley National Laboratory, Nov 2026).
- The annual cost of that asthma is an estimated $3.5 billion (Lawrence Berkeley National Laboratory, Nov 2026).
- Home dampness and mold account for 8% to 20% of common respiratory infections (Lawrence Berkeley National Laboratory, Nov 2026).
Water in the house right now? Call (469) 991-2658 to reach a local Dallas restoration crew, day or night, and start drying inside the 48-hour window.
Methodology and Sources
Every statistic on this page comes from the organization that produced the data: a government agency, a regulator, a university or a research firm reporting its own study. We do not cite statistics roundups or other websites' summaries. Each number carries the month and year its source published or last updated it. A few sources are live pages with no publication date, including the Triple-I fact page, three National Weather Service climate pages and the Berkeley Lab summary. Those carry the month we retrieved them, November 2026. Where we did our own arithmetic on a source's figures, the text says so. We review the page every month and replace figures when sources update.
Glossary
- NFIP: National Flood Insurance Program, the federal flood insurance program run by FEMA.
- TDI: Texas Department of Insurance, the state insurance regulator.
- TWDB: Texas Water Development Board, the state agency behind the State Flood Plan.
- DFW: Dallas-Fort Worth. Weather records cited here come from DFW International Airport.
- 100-year floodplain: land with a 1% chance of flooding in any given year.
- 500-year floodplain: land with a 0.2% chance of flooding in any given year.
- Loss ratio: the share of premium dollars an insurer pays out in claims.
- Real water loss: water that leaks from a utility's pipes before it reaches a customer.
- HO-3: the most common type of homeowners insurance policy.
Sources
- Insurance Information Institute: Facts + Statistics: Homeowners and renters insurance
- LexisNexis Risk Solutions: 2026 LexisNexis U.S. Home Insurance Trends Report (press release)
- Texas Department of Insurance: Texas homeowners insurance market overview
- Texas Department of Insurance: Insured Losses Resulting from the February 2021 Texas Winter Weather Event (data as of June 30, 2022)
- Texas Department of Insurance: Getting your insurance claim paid
- EPA WaterSense: WaterSense Statistics and Facts
- EPA WaterSense: Fix a Leak Week
- National Weather Service: DFW Precipitation Extremes
- National Weather Service: February 2021: Historic Winter Storm and Arctic Outbreak
- National Weather Service: Freeze Summary for Dallas/Fort Worth
- National Weather Service: New Climate Normals (1991-2020)
- National Weather Service: DFW Monthly and Annual Precipitation
- National Weather Service: Turn Around Don't Drown
- Dallas Water Utilities: Dallas Water Utilities FY25 Fact Sheet
- City of Dallas: Rising temperatures increase water demands
- City of Dallas: DWU Leak Detection and Repair/Replacement Programs
- Dallas City Auditor: Audit of Dallas Water Utilities Maintenance of Infrastructure (A16-003)
- Texas Water Development Board: 2024 State Flood Plan, Executive Summary
- Texas Water Development Board: 2024 State Flood Plan, Chapter 1
- Federal Reserve Bank of Dallas: Cost of Texas' 2021 deep freeze justifies weatherization
- University of Houston Hobby School: The Winter Storm of 2021
- Texas Department of State Health Services: February 2021 Winter Storm-Related Deaths, Texas
- FEMA: 13 Fast Flood Facts
- FEMA: Everyone Needs Flood Insurance fact sheet
- U.S. Government Accountability Office: Flood Insurance: Congressional Action Could Help Increase Coverage for At-Risk Properties (GAO-27-108012)
- EPA: A Brief Guide to Mold, Moisture and Your Home
- CDC: Mold
- Texas Department of Licensing and Regulation: Mold Remediation Consumer Protection
- Lawrence Berkeley National Laboratory: Reducing Dampness and Mold
Get a Dallas Crew Moving Now
Every hour of soaking pushes water deeper into drywall, subfloor, and framing. Call now and tell us what happened.